What Is Employee Idle Time? How to Measure It, Reduce It, and Use the Data
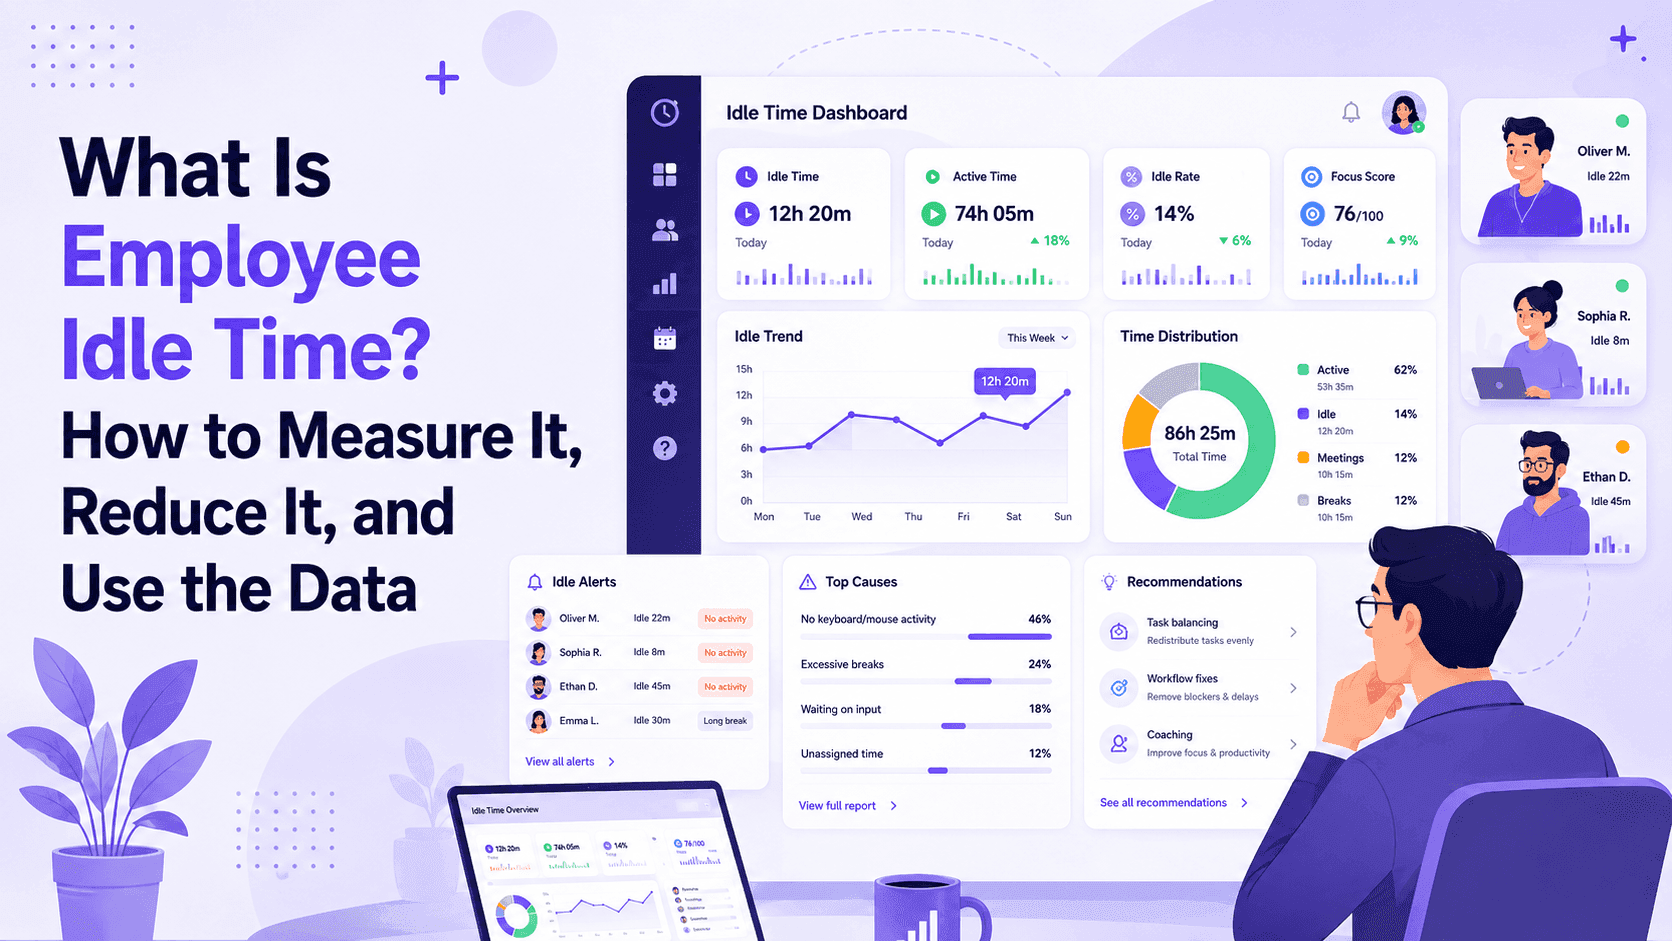
Employee idle time is periods during a work session with no detected keyboard or mouse activity. It does not always mean someone is not working. This guide explains how to measure it accurately, what the data means, how to set sensible thresholds, and how to use idle time information without micromanaging.
Every manager who has ever run a remote team has asked some version of the same question at some point: what is actually happening during those 8 hours?
Not necessarily out of distrust. But because when your team is not in the same building, the natural background signals of an office disappear. You do not see who looks focused, who is stuck, or who has quietly checked out for the afternoon.
Idle time data is one answer to that question. A desktop monitoring agent tracks keyboard and mouse activity, and any period without detectable input for longer than a set threshold gets flagged as idle. The result is a percentage of each employee's shift classified as active versus idle.
The data is genuinely useful. It is also genuinely misunderstood. Idle time does not always mean someone is not working. Reading a long document, listening to a call, thinking through a complex problem, or watching a training video all produce idle signals even when the employee is fully engaged.
This guide covers exactly what idle time is, how it is measured, what different idle patterns mean, how to configure thresholds that produce useful signals rather than noise, and how to use idle time data in a way that actually helps your team perform better rather than just creating anxiety.
What Is Employee Idle Time?
Employee idle time refers to periods during a scheduled work session when no keyboard or mouse activity is detected for longer than a defined threshold. In workforce monitoring software, this is typically measured by a desktop agent running on the employee's computer during their shift.
Idle time can reflect several different situations:
- The employee stepped away briefly (bathroom break, water, a short walk)
- The employee is in a meeting or on a phone call where they are not using their keyboard
- The employee is reading a long document, reviewing a contract, or watching a video
- The employee is thinking through a problem or planning without typing
- The employee has genuinely left their desk for an extended period during work hours
- The employee has a technical issue: slow internet, a system crash, or a platform outage
This range of causes is why idle time data is most useful as a trend indicator rather than as moment-by-moment evidence of a specific behavior. A single idle window tells you almost nothing useful. A pattern of idle time across days and weeks tells you something worth paying attention to.
How Idle Time Is Measured
Workforce monitoring tools measure idle time through a desktop agent that runs on the employee's computer during a logged work session.
The agent monitors:
Keyboard input. Any key press resets the idle counter back to zero.
Mouse movement and clicks. Any mouse activity, including scrolling, also resets the idle counter.
Active window focus. Some tools also check whether the foreground application window is actively engaged, which can detect activity even when there is minimal keyboard or mouse input, for example during video playback in a presentation.
When none of these signals are detected for longer than the configured threshold, the current window is flagged as idle. Once any activity resumes, the idle flag closes and active tracking restarts.
Screenshots captured during idle windows are automatically marked as idle screenshots in HoraFlow and are easy to filter out when reviewing. You do not have to sort through idle lockscreen captures manually.
Setting the Right Idle Time Threshold
The threshold you configure determines what gets flagged as idle and what does not. This configuration decision has a bigger impact on the usefulness of your data than almost anything else.
A threshold that is too short (under 3 to 4 minutes) will flag bathroom breaks, short pauses during reading, natural cognitive rest between tasks, and brief social interactions as idle time. The result is an inflated idle percentage that does not reflect real disengagement and that employees will rightfully find frustrating.
A threshold that is too long (over 30 minutes) will miss genuine extended absences from the workstation. A 45-minute unexplained gap would not appear in your data at all.
A threshold between 5 and 15 minutes is appropriate for most teams. It allows for natural short breaks without flagging them, while still identifying extended periods of inactivity that are worth noting.
For roles that involve significant reading time (legal review, document analysis, research roles), consider whether a slightly higher threshold makes sense. A lawyer reviewing a 200-page contract will show idle time even while doing focused work.
In HoraFlow, the idle detection threshold is configurable, and the default is calibrated to avoid flagging brief natural breaks while still surfacing meaningful idle patterns.
Types of Idle Time: Normal vs. Concerning
Not all idle time is the same. Understanding the difference between expected idle time and potentially concerning idle time is the key to using this data effectively.
Normal and Expected Idle Time
Short breaks. Bathroom breaks, getting water, a brief walk, or a five-minute personal call. These should not register as idle at all with a sensible threshold. If they do, recalibrate the threshold.
Video calls and meetings. An employee in a 90-minute video call will show lower keyboard and mouse activity for that window even though they are actively present in a work meeting. Some tools detect meeting software usage separately and handle this context appropriately.
Reading-heavy work. Extended document review, reading code, researching, or working through written material can generate significant idle periods even during genuinely focused work.
Deep thinking time. Developers, writers, analysts, and strategists spend meaningful parts of their day not typing. Some of the most valuable work that happens in knowledge roles is not visible in keystroke data.
For most knowledge workers, 15 to 25 percent of total logged work time being classified as idle is entirely normal and does not indicate low productivity or disengagement.
Potentially Concerning Idle Time
Extended gaps of 2 to 3 hours with no activity during core shift hours. A single long idle window is worth noting but rarely worth acting on immediately. A recurring pattern of them across multiple days in the same week is worth a conversation.
Idle time consistently concentrated at the same period each day. If idle time spikes at 2 PM every day for three weeks for a specific employee, that pattern is more meaningful than a random scatter of idle windows.
A significant and sudden increase in idle percentage from one week to the next. If someone's normal active rate is around 75 percent and it drops to 40 percent for two consecutive weeks without an obvious explanation, that is a signal worth following up on.
Idle percentage consistently above 40 to 50 percent over multiple weeks. This level of persistent inactivity across a substantial portion of a full-time shift is worth investigating through a direct conversation.
[Image: A weekly idle time bar chart showing 5 working days. Each bar is split into green (active) and yellow (idle) segments. Monday through Thursday show approximately 20 to 25 percent idle, shown in a light green bordered box labeled Normal range. Friday shows 58 percent idle, shown highlighted in amber with a small flag icon labeled Worth reviewing. Clean data visualization style, white background, labeled percentage axes.]
What Idle Time Data Actually Tells You
When you look at idle time data across your team over a meaningful period, here is the kind of insight it can surface:
Workload imbalances. If some employees consistently have low idle time (very high active rates) while others have consistently high idle rates, that is often a workload distribution problem, not a motivation problem. The high-idle employees may not have enough meaningful work assigned. The low-idle employees may be overloaded.
Meeting-heavy days. A team-wide spike in idle percentage on Wednesdays might simply reflect that Wednesday is your heaviest meeting day. Video call time does not register as keyboard or mouse activity in most systems. Cross-referencing with calendar data quickly confirms this pattern.
Connectivity or technical problems. A sudden spike in idle time for a specific employee that does not match their normal patterns can indicate a technical issue: slow internet, a device problem, or a platform outage. This is an easier investigation to start than an assumption about motivation.
Potential wellbeing signals. Gradually increasing idle time over several consecutive weeks, combined with lower productivity scores and reduced communication, can be an early signal of disengagement, burnout, or a personal situation. The data does not tell you why. It tells you that something has shifted and that a check-in conversation is worth having.
Project blocking or unclear task assignments. Employees who do not know what to work on next, or who are waiting on a dependency from another team member, will accumulate idle time. High idle rates after a project handover or at the start of a new assignment often point to this.
How to Use Idle Time Data as a Manager
The most common mistake managers make with idle time data is reacting to individual moments rather than patterns.
A team member who is idle for 45 minutes on a Thursday afternoon is not necessarily disengaged. They might have been in an unscheduled call, dealing with a brief personal issue, working through a problem that required no typing, or taking an early lunch.
A team member whose idle time has been climbing every week for the past month, whose project contributions have slowed, and who has been less communicative than usual is showing a pattern worth addressing.
How to approach a pattern-based conversation:
- Look at data across three to four weeks, not a single day or week
- Compare the person's idle percentage to their own historical baseline, not to a universal standard or to a different role
- Cross-reference with project output and communication patterns before drawing conclusions
- When the pattern is clear, start with a check-in framed around wellbeing: "I noticed your active time has been lower over the past few weeks and wanted to check in to see how things are going"
- Keep the first conversation exploratory, not disciplinary
How to Reduce Problematic Idle Time
If you have identified a genuine and consistent pattern of disengagement rather than false positives or normal variation, here are the most common operational causes worth addressing:
Unclear task assignments. Employees who finish one task and do not know what to work on next default to waiting. Clear daily priorities and a defined queue of next tasks reduce this significantly. A brief async check-in at the start of each shift helps employees orient without requiring a live meeting.
Task dependencies causing waiting time. Someone who has finished their portion of a project and is blocked waiting for another team member to complete their part will accumulate idle time through no fault of their own. Mapping dependencies in advance and flagging blockers quickly reduces this.
Scheduling that conflicts with natural productivity patterns. The activity heatmap in HoraFlow shows when each person and team does their most focused work by hour and day. If a team member's scheduled shift does not align with their natural productive window, idle time will be higher than it would be with a better schedule match.
Burnout from recent overload. Employees who were recently running at high intensity may go through a lower-engagement period afterward. Idle time increasing after a demanding sprint is sometimes a recovery pattern, not a motivation problem. The context around the data matters.
Lack of connection to the work. Employees who do not understand how their role connects to broader team goals, or who feel their contributions are not recognized, are more likely to disengage. Idle time is one symptom of a management and culture problem, not the cause.
Idle Time, Productivity Scores, and Screenshots Working Together
In HoraFlow, idle time is one component of a broader picture rather than a standalone metric.
The daily productivity score combines idle time with keyboard activity, mouse movement, active application usage, and screenshot context. A high idle percentage lowers the score, but the score also reflects the type of activity during active periods, which gives managers a more complete picture than idle percentage alone.
Screenshots taken during idle windows are automatically flagged and separated from active screenshots. When a manager reviews screenshot captures, idle frames are already filtered so you are looking at a sample of actual work sessions rather than sifting through lockscreen images.
The practical workflow looks like this:
- Morning digest email flags any employees whose idle rate was significantly above their baseline the day before
- Manager checks the weekly trend view to see if this is an isolated day or a pattern
- If a pattern exists, manager looks at the productivity score breakdown and screenshot samples for context
- If the context suggests a real issue, manager initiates a check-in conversation with the employee
- If the context suggests a technical issue, a meeting-heavy day, or a role with reading-intensive work, the flag is noted and monitored rather than acted on immediately
Frequently Asked Questions
What is employee idle time in workforce monitoring?
Employee idle time is any period during a logged work session when no keyboard or mouse activity is detected for longer than a configured threshold. It is measured automatically by the desktop monitoring agent and reported as a percentage of total logged shift time.
Is 20 percent idle time normal for remote workers?
Yes. For most knowledge workers, 15 to 25 percent of logged work time being classified as idle is entirely normal. This accounts for short breaks, video meeting time, reading-heavy tasks, and natural cognitive pauses between focused work. Consistently high idle rates above 40 to 50 percent over multiple weeks are more worth investigating.
Does idle time mean an employee is not working?
Not necessarily. An employee in a video meeting, reviewing a long document, listening to a training recording, or thinking through a design problem may show as idle even while doing focused, valuable work. Idle time is a data signal, not a behavioral verdict.
How should managers respond to high idle time?
Look at patterns over three to four weeks rather than reacting to individual days. Compare the idle percentage to the employee's own historical baseline, not to a universal standard. Cross-reference with project output and communication before drawing conclusions. If a pattern suggests an issue, start with a check-in conversation framed around wellbeing rather than accusation.
What idle time threshold should I use?
A threshold between 5 and 15 minutes works well for most teams. Thresholds under 3 minutes generate false positives for normal short breaks. Thresholds over 30 minutes miss meaningful extended absences. For roles with significant reading or review work, consider a slightly higher threshold.
Does HoraFlow alert managers about idle time in real time?
HoraFlow sends managers an alert when an employee's idle time during a shift exceeds a significant threshold. This is intended to flag potential issues such as connectivity problems, accidental clock-ins, or genuine extended absences rather than to enable real-time micromanagement of activity.
Can employees see their own idle time data?
Yes. Employees can see their own productivity score, active time, and idle time in their personal HoraFlow dashboard. This transparency helps the tool feel fair and bilateral rather than purely one-directional.
How is idle time different from a productivity score?
Idle time is a raw metric: the percentage of logged work time with no detected keyboard or mouse activity. The productivity score is a composite that incorporates idle time alongside keyboard and mouse activity, active application focus, and screenshot context. The score is a more complete indicator of engagement. Idle time is one of its inputs.
What causes a sudden increase in employee idle time?
Common causes include connectivity issues, unclear task assignments, waiting on blocked dependencies, heavy meeting schedules, a recovery period after high-intensity work, personal circumstances, or genuine disengagement. The data surfaces the shift; a direct conversation explains why.
Does idle time tracking violate employee privacy?
Idle time monitoring tracks keyboard and mouse activity to determine whether an employee is at their computer during a logged work session. It does not record which specific keys are pressed, access personal files, activate cameras, or monitor activity outside of defined work hours. Standard idle time monitoring on company equipment during work hours falls within the bounds of normal workforce monitoring in most jurisdictions.
How long does it take to establish a meaningful idle time baseline?
Most managers find a clear individual baseline emerges after two to three weeks of consistent tracking. The first week may show slightly different patterns as employees adjust to the tool running. By week two to three, the idle percentages tend to reflect normal work habits and can serve as the baseline for comparison going forward.
The Short Version
Employee idle time is a useful data signal when you understand what it does and does not indicate. It is not a measure of how hard someone is working. It is a measure of keyboard and mouse activity relative to total logged shift time.
Used well, idle time data helps managers spot workload imbalances, identify potential technical issues, catch early signs of disengagement, and make better scheduling decisions. Used poorly, it becomes a source of micromanagement pressure that reduces output rather than improving it.
HoraFlow includes idle detection as part of a broader productivity picture alongside activity scores, screenshots, project-level time data, and the activity heatmap. The combination gives you context rather than just a raw number to react to.
Book a 10-minute demo and see how idle time data fits into the full HoraFlow productivity view.